Airports Leverage Technology to Take the Mystery Out of Security Wait Times
Wait times at TSA checkpoints became a hot topic this summer, especially when passengers stuck in screening lines began missing flights after arriving hours before their departure times. As lines grew, so did the frustration, and U.S. airports redoubled ongoing efforts to keep passengers happy while maintaining high security levels.
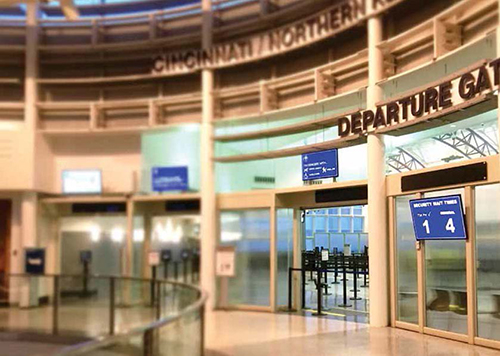
As conversation ensued about TSA staffing and funding levels, some airports focused on the psychological aspects-that the unknown nature of checkpoint wait times fuels passengers' discontent and that lines can look worse than they actually are. Three airports in particular-Orlando International Airport, Cincinnati/Northern Kentucky International Airport and San Antonio International Airport-had a jump on the situation, because they had already installed systems that provide estimated wait times when the topic became a national news story. The systems they deployed use Wi-Fi, Bluetooth and video analytics in various combinations.
| FACTS&FIGURES Project: Calculating & Displaying Security Wait Times Key Benefits: Easing passenger anxiety; offsetting negative appearance of lines; optimizing checkpoint efficiency  CINCINNATI-NORTHERN KENTUCKY INT'L AIRPORT Est. Annual Traffic: 6 million passengers Technology Deployed: Bluetooth/Wi-Fi hybrid Product Installed: BlipTrack, from BLIP Systems/Lockheed Martin  ORLANDO INT'L AIRPORT Est. Annual Traffic: 40 million passengers Technology Deployed: Video plus Wi-Fi; Bluetooth Product Installed: QueueAnalyzer, from SITA SAN ANTONIO INT'L AIRPORT |
Technology Bake Off
In May, just before summer travel began, the Greater Orlando Airport Authority announced several initiatives underway to ensure quick, efficient flow through the screening process at Orlando International Airport (MCO). Authority staff members were already meeting with the TSA team on a daily basis, and contract personnel were added to help during the upcoming busy summer months. About one year prior, the authority had invested in a software program that predicts checkpoint wait times and improved wayfinding by using 1,000 beacons and a few dozen cameras.
Carolyn Fennell, the airport's senior director of public affairs and community relations, explains that passenger demographics at MCO significantly affect its checkpoint operations. Fully 95% are origination/destination travelers, so more people pass through its checkpoints than airports with more connecting passengers, she explains. MCO also has a high concentration of tourist traffic and infrequent travelers, who typically consume more time at checkpoints.
To find the best technology to suit MCO's particular needs, the airport authority invited companies to compete for a checkpoint queuing solution contract. The bake off, as some called it, also allowed airport personnel to see how various technologies worked at their facility. After testing multiple options, the authority chose SITA's QueueAnalyzer, which combines historical and real-time data with algorithms to deliver wait-time predictions by leveraging information collected via Bluetooth, Wi-Fi and cameras. By recording data on an hourly, weekly, monthly and year-to-year basis, the system provides information that helps the airport keep wait times at reasonable levels, says SITA Senior Product Manager Kevin Peterson.
"We have about 12 lanes at two checkpoints, and it can give the visual appearance of being very crowded," says MCO Director of Information Technology John Newsome. "Even for those of us who travel often, going through an unfamiliar airport can cause anxiety."
According to Newsome, MCO's best measures have come from mobile devices. "We measure the progress of a mobile device without identifying an individual, by using a unique identifier," he assures. "We see smart-watches, Fitbits, phones...anything that uses Bluetooth or Wi-Fi. It's a huge sample size."
Using multiple technologies improves the system's accuracy. "We lean on Bluetooth, primarily, and that sample size has been growing quickly because of wearables and watches," explains Peterson. "A Wi-Fi-to-Bluetooth network interface device connects the Bluetooth sensors to the cloud-based application server; we use Wi-Fi generally to sense how busy the area is. It's a component of the algorithm."
Peterson estimates the system's accuracy at about 98%, noting that a significant portion of the data for the algorithm comes from the video feed.
"For this application, we don't use streaming video, we use consecutive snapshots to take a count," he notes. "The accuracy is driven by having multiple technologies/data sets, and the sophistication of the mathematical algorithm. We can measure the frequency of entry and exit and distinguish patterns of passenger movement to determine who is a passenger and who is not."
After the system was installed, MCO personnel noticed that its accuracy dropped dramatically when queues grew long, because travelers were lining up beyond the sensors' range. With increased traffic expected for spring break, MCO installed more cameras at the end of the concourse, so they could view the entire line.
The system displays wait times on screens near the checkpoint, at check-in counters, and on MCO's mobile app. Soon, wait times will also be listed on the airport's website. "We are careful to say that the numbers can change rapidly," notes John Vinelli, manager of information technology for MCO.
 Newsome and Vinelli praise the onsite TSA team for its excellent relationship with the airport, noting that they meet frequently to discuss measurements and ways to maximize checkpoint efficiency.
Newsome explains that providing passengers with wait time information helps offset the appearance of long lines. "Information is power," he explains. "If we display the wait time for them...they feel better. It's a way of keeping the anxiety down, and that fits in with our overall objective to have well-informed, relaxed passengers. It fits with the water features, the lighting, the music and all the rest we have here in Orlando to make [air travel] a less stressful process."
New Info on Existing Displays
In 2014, San Antonio International Airport (SAT) requested competitive bids for a video-based system to calculate and display wait times for the TSA checkpoint in Terminal A, the larger of its two terminals. Specifically,  officials wanted a system that could display estimated wait times on dedicated monitors and on the airport's existing multi-user flight information display system.
"Sometimes when our checkpoint line gets long, it can become relatively unstructured because our stanchioned queuing space is limited," explains SAT Chief Strategy and Development Officer Nathan Polsgrove. "Passengers would see the line and panic. The wait might have looked like 45 minutes, when in reality it might have been 20 minutes. The issue we had wasn't that the wait time was too long, rather it was that the passenger thought it was longer than it actually was. We wanted to relieve anxiety when the passengers saw the long line."
After reviewing its options, the airport selected TRAX, a passenger queuing system from Infax. A series of 10 video analytics cameras now monitor passenger movement through the queue, and software calculates the time it will take passengers to get through the checkpoint. Estimated wait times are then displayed on two dedicated 48-inch monitors.

Because TRAX interfaced with the airport's pre-existing multi-user flight information display system (also by Infax), wait times are displayed on flight information monitors throughout the terminal and on SAT's website as well.
Debbie Drew, manager of Planning and Administration at SAT, says the airport team performed extensive research about Bluetooth vs. Wi-Fi vs. video and consulted several other airports to learn what worked there, and why. Based on their findings, they chose a video-only system.
"Some think it would be too expensive to use video to measure wait times; but it's actually a simple way to capture data and use some existing infrastructure to improve operations as a whole," says Tracy Davis, director of Transportation Sales for Infax.

Original plans for SAT's new system only included cameras along the main entry corridor for Terminal A. "What we found is that more people were also utilizing our PreCheck and frequent flyer entrance locations. Consequently, the numbers at the exits were getting skewed," explains Henry Galindo, who was the airport's information technology project manager/senior management coordinator at that time. "When we started comparing entry to exit numbers, we had to figure out why there were more exit numbers. At first, we thought the system was just calibrating itself until we analyzed the data." To remedy the situation and obtain more accurate counts, SAT installed two additional cameras at the alternate entrances.
The team also learned that the terminal's high ceilings would be a challenge during camera installation. Working closely with Infax, they designed a custom gooseneck fixture to hold the cameras in place. In retrospect, more pre-planning about camera setup and operation would have helped, notes Galindo.

That said, learning about other airports' trials helped the overall planning process. "By getting more granular, we can then use that information to be more detailed on our own dashboard," says Polsgrove.
The decision to post specifics online sparked a lot of debate, notes Drew. Those against the idea worried that passengers might check wait times on SAT's website, arrive late and try to hold the airport liable for missed flights. Adding a disclaimer on the website was designed to assuage such concerns.
Leveraging Data to Manage Growth
In the last several years, Cincinnati/Northern Kentucky International (CVG) has experienced major changes that, in turn, prompted the airport to alter its checkpoint configurations. In May 2012, CVG closed Terminal 2 and  consolidated all non-Delta operations in Concourse A, which had been recently renovated. Terminal 1 was closed three years later and then torn down early this spring. Shortly after that, crews demolished Terminal 2 to make room for a consolidated rental car facility and expansion to Concourse A.
Suddenly, CVG staff found themselves with longer security lines. In addition to devising ways to keep wait times reasonable while shifting the checkpoint, they also looked for a tool to assess wait times.
With new systems in place, the airport has reduced its wait time by about one-third, reports CVG Vice President of Customer Experience Brian Cobb. "Now we're down to 30 minutes or less at peak, and we're consistently below 15 minutes on average for general security."
The airport began by partnering with Purdue University, which was researching Bluetooth technology. Impressed with its findings, CVG set out to find a commercial solution. "We put out a proposal to see what was on the street and discovered there is no 'one size fits all'," recalls Cobb. "Heat-seeking cameras didn't work for us because of our high ceilings. We ruled out video cameras, because that program was cost-prohibitive for us and there wasn't enough camera platform for us to leverage."

After reviewing many options, CVG chose a queue management system from BLIP Systems/Lockheed Martin that combines Bluetooth and Wi-Fi. BlipTrack calculates checkpoint wait times by monitoring the flow of passengers with devices that use the two technologies.
"Two to three years ago, Bluetooth seemed to be a dying platform, and we felt it was not enough to ensure accurate measurements," recalls Cobb. "Using both Wi-Fi and Bluetooth together gives us a substantial sample size-more than enough to calculate wait times. There are several algorithms, and we do periodic manual testing to check our system accuracy."
Another factor that guided the airport's selection was the mounting/setup process. The new system didn't require much more than power-over-Ethernet connections to targeted sensors, notes Cobb.
Estimated wait times-averages of the previous 10 minutes-are now displayed prominently on a large screen in the terminal and on the airport's website. Separate times are calculated and shown for TSA PreCheck and general checkpoint lanes.

The system also sends color-coded mobile alerts to CVG operational staff. Management personnel receive yellow warnings when passengers wait more than 20 minutes and red messages when it stretches to 30 minutes or more. "[This] essentially means that I don't have to be tied to a desk," says Cobb. "I get mobile alerts on my phone...and we then share that info with our airline partners and TSA contacts."
Using data gathered by the airport's new system, the TSA team was able to reschedule its shifts. Previously, it had eight or more staggered start times per shift; now officers begin in larger groups.
"If you're able to see how people move, if you're able to see bottlenecks, you can react," says Christian Bugislaus Carstens, marketing manager at BLIP Systems. "Previously, the airport would forecast and plan based on last year's arrivals. If you don't take into account new routes, seasons, events, you can miscalculate on staffing. If you're able to look at how queue times are during the day, then you're able to have a dynamic solution to see how you should react."
From the airport's perspective, BlipTrack also helps address the "perception is reality" issue that plagues the entire industry. "Security is the biggest pinch point in most airports," explains Cobb. "If a customer sees a long line, the anxiety goes through the roof. This [system] allows us to alleviate some of that stress. We have the ability to look at all three TSA product types (PreCheck, general and special assistance) to see how the customers are getting through the lines. Then, TSA can see the ebbs and flows of the customer base with each of their three products, and can adjust accordingly if they so choose. Now, we can see exactly what times the problems occur and let them see the gaps."
 CVG is currently adding additional sensors to see which lanes are open and closed throughout the day. The next step is to establish a "show-up profile."
"Leisure travelers' profiles are very different than business travelers'," Cobb relates. "The problem with the checkpoint is that you never know when the flood is going to hit you. We may know how many customers are coming that day, but we don't know what time they'll show up at the checkpoint. So we can look to see which airlines are flying that day and we will know what kinds of flights and what types of passengers are traveling. Then, we can hand the TSA that data, and from a staffing perspective, we're better prepared that way than throwing additional people on the lines. We can focus on being more efficient."
The airport and BLIP Systems are also adding sensors outside the terminal and throughout the facility to track where passengers are parking and queueing. The data they collect will show how many drivers are parking in off-site competitors' lots and map where passengers are dwelling once inside the terminal. The information will help CVG target its marketing and win customers in areas where competition is fierce, notes Cobb.
"If you take a look at our airport overall, this data capability is a small positive spot in the middle of an incredible growth spurt," he comments. "We have done a great job recovering quickly, and this technology is one step into better using our data."
What's Next?
"Airports are taking a wider approach to thinking about different types of 'data sets' to give the passenger the right information, at the right time, at the right place," says Manik Arora, president and chief executive officer of Arora Engineers. "Parking management, queue management, terminal movement analytics, fleet management, ground transportation, and facility and airfield intelligence are all playing an important role in providing statistically measured 'big data' to the user, inclusive of any Apple, Android or any new platform device."
Airports that can look at it from an enterprise point of view will be able to make smart, data-driven decisions for enhancing the passenger experience and increasing operational efficiencies across the airport, he adds.
Currently, Arora and his team are working on a pilot that uses Smart Tags to track wheelchairs and the personnel who push them. Airports could also use the devices or cellular devices to track employees and determine who is closest to resolve a variety of service issues.
Looking ahead, Arora anticipates movement away from separate beacons and toward Bluetooth-controlled lights that will also gather data. In fact, he predicts that almost every device on the airfield or in the terminal will eventually include sensory capabilities.
Davis, from Infax, says the next level is infrared 3-D laser sensors. "We have a 3-D laser solution that we roll out in restroom areas," she says. "When it hits [a predetermined] threshold of passenger throughput, the system alerts the staff to clean the restroom. Using sensors, we can then track when the janitorial carts arrive to the restroom to service it."
The company can also add hardware in other areas to measure general dwell time, concessions traffic, response by ground transportation and more, notes Davis. "The solution allows the airport to view the movement of passengers, dwell times and assets on a terminal map," she adds. "This helps the airport see a complete picture of how passengers are flowing and where they are spending their time, which not only helps the airport improve the passenger experience, but also operations and concessions as well."
For checkpoint areas, SITA is working on an open lane detection enhancement to help determine how many lanes should be operating based on the number of passengers flowing through. For airports with more than one checkpoint, the company offers load balancing to show passengers which checkpoint has the shortest wait time.
"Airport buildings are living and breathing organisms," observes Arora. "Technology and innovation are moving so fast, that it's smart for airports to keep their minds and initiatives open to changing infrastructure."
He also advises airports to create master plans that consider return on objectives as well as return on investment. "This should at least help identify priorities and quick wins," he explains.
FREE Whitepaper
PAVIX: Proven Winner for All Airport Concrete Infrastructure

International Chem-Crete Corporation (ICC) manufactures and sells PAVIX, a unique line of crystalline waterproofing products that penetrate into the surface of cured concrete to fill and seal pores and capillary voids, creating a long lasting protective zone within the concrete substrate.
Once concrete is treated, water is prevented from penetrating through this protective zone and causing associated damage, such as freeze-thaw cracking, reinforcing steel corrosion, chloride ion penetration, and ASR related cracking.
This white paper discusses how the PAVIX CCC100 technology works and its applications.
Featured Video
Featured Video
Digital Issue:
Connect


Publisher's Blog

# # #
Industry Insider

Project Nominations
Know of a project that should be covered in a future issue of Airport Improvement?
Artscapes
")
# # #
# # #
# # #
Airport Industry Headlines
- Tucson International Airport Records Busiest Month since March 2008
- Austin-Bergstrom celebrates start of construction on key Journey With AUS expansion project
- Fresno Yosemite International Airport Launches Accessibility Initiative MagnusCards
- British Airways Begins Twice-daily Flights to London from San Diego International Airport
- Hartsfield-Jackson to Enforce Access Restrictions Around the Clock
# # #
Airside Projects
- New Apron Lighting Resolves Glaring Issues at Dallas Love Field
- Florida’s Statewide Markings Program Evolves
- Lincoln Airport Takes Creative Route to Adding New Leisure Service
- New Taxiway at Myrtle Beach Int’l Improves Airfield Safety, Frees Space for Terminal Expansion
- Tampa Int’l Plots New Course to Enhance Airfield Safety
Baggage Projects
- Rapidly Growing Volume of Oversized Baggage Prompts System Redesign at Salt Lake City Int’l
- Columbia Metropolitan Upgrades Baggage System and Ticketing Lobby
- Long Beach Airport Adds Permanent Checked Baggage Inspection System and Improves Ticketing Building
- New Concourse at Phoenix Sky Harbor Features Advanced Baggage Handling System
- New Baggage System at Orlando Int’l Features Individual Totes and Upper-Level Claim Area
# # #
Cargo Projects
- Spokane Int’l Builds Rail-Truck Facility on Surplus Land
- Halifax Stanfield Builds Cargo Park With Cold Chain Capabilities
- Extensive Cargo Growth at Cincinnati Int’l Boosts Revenues, Diversifies Business Base
- FedEx Expands at Ontario Int’l to Support Growing E-Commerce Demand
- Winnipeg Int’l Adds Multiuse Facility to Enhance Cargo Operations
Concessions/Retail Projects
# # #
Emergency Operations Projects
- Decatur Airport Builds New Facility for Firefighting and Maintenance Teams
- Naples Airport Recovers After Hurricane Ian’s Saltwater Storm Surge
- Sacramento Int’l Builds Bigger, Better Fire and Rescue Station
- Hybrid Fire Station at San José Int’l Provides Emergency Services for Airport and Surrounding Area
- New Facility at Coastal Carolina Regional Consolidates ARFF Ops, Boosts Efficiency
Environment/Sustainability Projects
- Toronto City Airport Leads the Move to Fluorine-Free Firefighting Foam
- New Noise Technology System at Minneapolis-St. Paul Int’l Earns Patent
- Martha’s Vineyard Airport Tests Underground Filtration for PFAS Contamination
- Santa Maria Airport Takes Common Sense Approach to PFAS Testing
- Philadelphia Int’l Follows Envision Program for Major Taxiway Rehab
# # #
Fuel Operations Projects
General Aviation Projects
Ground Support Projects
- Montgomery Regional Leaps Into the Future With Electric Aircraft Chargers
- Exterior Jet Bridge Coating Saves Energy, Increases Passenger Comfort at Harry Reid Int’l
- O’Hare Moves Aircraft Deicing From Gates to High-Tech Centralized Facility
- Ground Power Upgrades in the Works at Newark Int’l
- Long Beach Airport & Airline Partners Phase Out Fossil Fuels for Ground Support Equipment
# # #
Hangar Projects
IT/Communications Projects
- Website Platform Helps Airports Attract More Customers
- Virtual Ramp System at Kansas City Int’l Provides 360-Degree View of Airfield
- Interactive Web Page Offers Planning Tools for Memphis Int’l Travelers
- Seattle-Tacoma Int’l Invests in Data Management Upgrade
- Philadelphia Int’l is Updating - and Monetizing - Its Information Technology Network
Landside Development Projects
Operations Projects
- Terminal Expansion at Kansas City Int’l Prompts New Snow Removal Strategy and Equipment
- New Glycol Recycling Facility at Syracuse Hancock Int’l Produces Deicing Fluid Certified for Reuse
- Drones and Virtual Reality Speed Control Tower Siting at Boulder City Municipal
- St. Louis Int’l Looks to Future With Master Plan Projects to Consolidated Terminals
- Sweet Charity: Airports Large and Small Open Their Facilities to Support Local Fundraisers
Parking Projects
- Sarasota-Bradenton Int’l Adds New Cellphone Lot With Improved Amenities
- Flagstaff Pulliam Implements Paid Parking Program
- New 7-Level Garage Increases Parking Capacity and Convenience for Customers
- Regina Int’l Optimizes Parking with 24/7 Call Center and On-site Customer Service Reps
- Canyonlands Regional Upgrades its Parking Payment/Collections System
Passenger Transport Projects
- Plane Train Extension is on Track for 2025 Delivery at Atlanta Int’l
- “Wingless Travel” Takes Flight at Regional Airports
- Inductive Charging for Electric Shuttles
- Winnipeg Int’l Launches Self-Driving Wheelchair Service
- Long-Awaited Rail Extension Is Just the Ticket to Spur Growth at Washington Dulles
Runway/Ramp Projects
- Vancouver Int’l Turns Untimely Winter Storms Into Opportunity for Improvement
- Airports Apply Heavy Surface Treatment to Increase Service Life of Asphalt Runways
- Round-the-Clock Work Helps Cheyenne Regional Finish Paving Project On Time
- Finish Line in Sight at St. Louis Lambert Int’l
- Pangborn Memorial Readies for Bigger, Greener Future With Apron Expansion
Security Projects
- Automated Exit Safeguards and Welcomes Passengers Arriving at Oakland Int’l
- Miami Int’l Tests Perimeter Intrusion Detection and Deterrence Technologies
- New Terminal Connector/TSA Checkpoint Eliminates Passenger Flow Problems at Lehigh Valley Int’l
- Philadelphia Int’l Installs Biometric Facial Recognition at 25 Gates
- Miami Int’l Serves as TSA Test Site for Technologies to Help Detect Drones
Terminal Projects
- Terminal Modernization at Boston Logan Has Passengers and Locals Seeing Red, But in a Good Way
- Massive Restroom Renovations in Progress at Miami Int’l
- Waco Regional Uses CARES Act Funds for Terminal Renovation Project
- New Terminal Connector Improves Passenger Accessibility at Los Angeles Int’l
- Watertown Regional Builds Old-School Charm Into New Terminal
# # #
# # #